GIS 335
Investigating Population Characteristics of Wisconsin
Introduction:
Political campaigns that are successful possess an understanding of important regional population characteristics. This understanding is critical for efficient and strategic campaigning. Current election cycles show the importance of strategic campaigning. Time and money are often limited, so candidates must isolate key areas to spend time in.
The background for this project involved taking on the role of someone working for a candidate running for president during the presidential primaries. To maximize voter turnout, this candidate is targeting young males specifically in the 21-year old age group. Males of this age are important constituents of this candidate so maximizing their vote is crucial for success.
Some of the goals for this project included downloading census data from an online source, downloading a shape file from the census data, joining tables from both sources, and mapping the census data.
Methods:
The first step involved downloading 2010 census data from the Wisconsin Census Department. This involved going online to Fact Finder Census Data. An advanced search was required to obtain the desired data. The advanced search involved choosing under Topics, People, Basic Count/Estimate and then population total. The area was selected by choosing Geography, Counties, County 050, and then Wisconsin. The data was then selected from the 2010 SF1 Dataset.
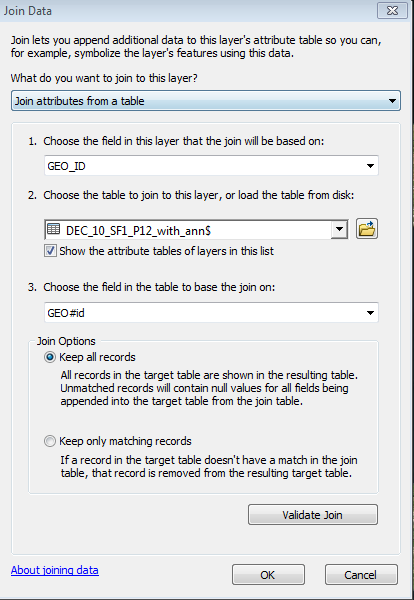
The next step involved downloading a shape file from the Wisconsin Census Data. This involved selecting Geographies, Options, Map Tables, and then downloading the file as a shapefile.zip. The shape file then had to be joined to the 2010 SF1 Dataset.

Sex and age population data was then downloaded from the same census data website. This was done by keeping the geographic area the same but choosing Topics, People, Sex and Age, and then Age in that order. A new layer to the map was then added including this data and the same shape file previously downloaded. The table from the age data was then joined to same shape file (shown by the figure to the right).
Finally, a map was created with two layers. One of the layers showed the population totals, and the other showed the proportion of the the population of males age 21. The proportion of the population of males age 21 was shown by creating a graduated colors map (as shown below). Some important feature classes that were included were major cities, major roads, and congressional districts. Counties, major cities, and congressional districts were labeled.
 Results:
The results of the project are represented by figure 1 shown below.

Figure 1. Two maps showing population density and percent population of males age 21. Major roads, major cities, and congressional districts are also represented in the maps.
References:
The next step involved downloading a shape file from the Wisconsin Census Data. This involved selecting Geographies, Options, Map Tables, and then downloading the file as a shapefile.zip. The shape file then had to be joined to the 2010 SF1 Dataset.
Sex and age population data was then downloaded from the same census data website. This was done by keeping the geographic area the same but choosing Topics, People, Sex and Age, and then Age in that order. A new layer to the map was then added including this data and the same shape file previously downloaded. The table from the age data was then joined to same shape file (shown by the figure to the right).
Finally, a map was created with two layers. One of the layers showed the population totals, and the other showed the proportion of the the population of males age 21. The proportion of the population of males age 21 was shown by creating a graduated colors map (as shown below). Some important feature classes that were included were major cities, major roads, and congressional districts. Counties, major cities, and congressional districts were labeled.

The results of the project are represented by figure 1 shown below.
Figure 1. Two maps showing population density and percent population of males age 21. Major roads, major cities, and congressional districts are also represented in the maps.
References:
American FactFinder - Search. (n.d.). Retrieved from http://factfinder2.census.gov/faces/nav/jsf/pages/searchresults.xhtml?refresh=t
No comments:
Post a Comment